How to view data from a Platform REST API on QlikView?
To connect QlikView to a REST API, you need to have an already-created REST API in the platform, and to have access to it. You also need to have installed the QvRestConnectorto make connections from QlikView to a REST API.
On this basis, the REST API will be available in a URL similar to this one:
https://lab.onesaitplatform.com/api-manager/server/api/v1/API_NAME/
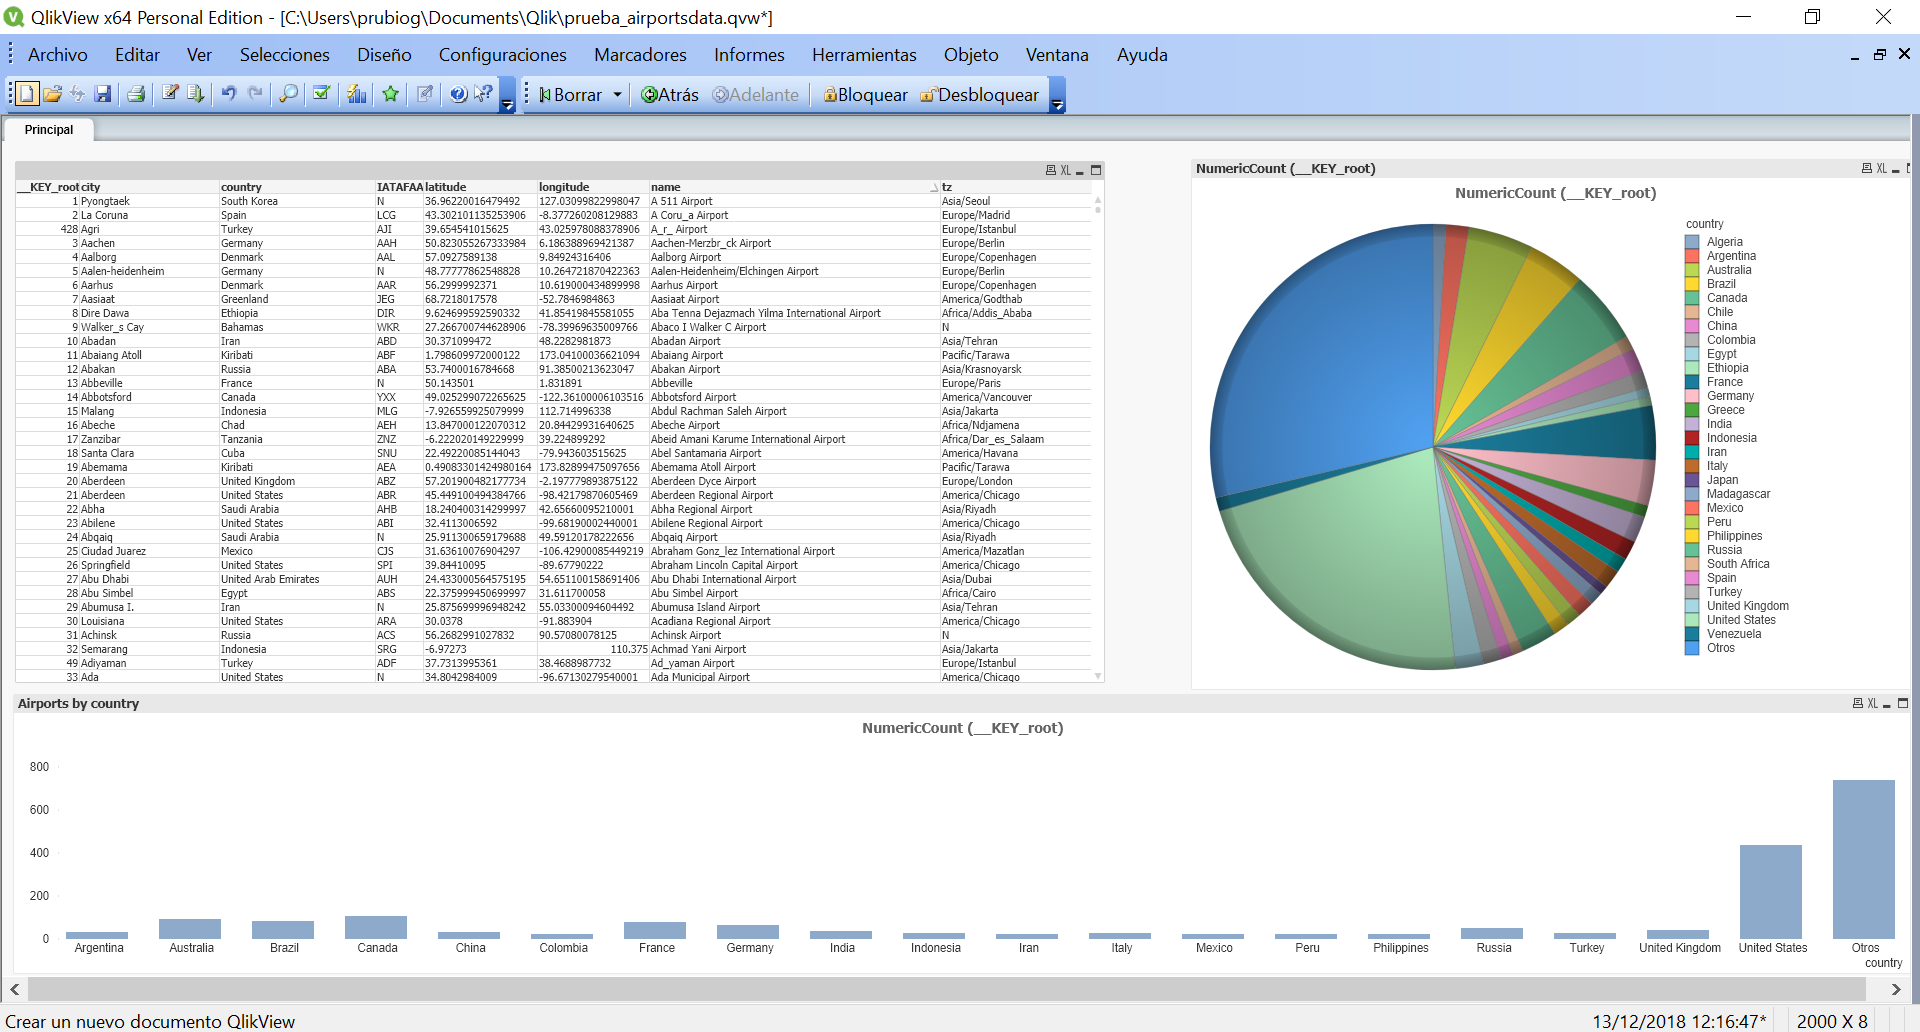
In this case, the HELS2 API is associated to the Ontology airportsdata, with data on airports all around the world
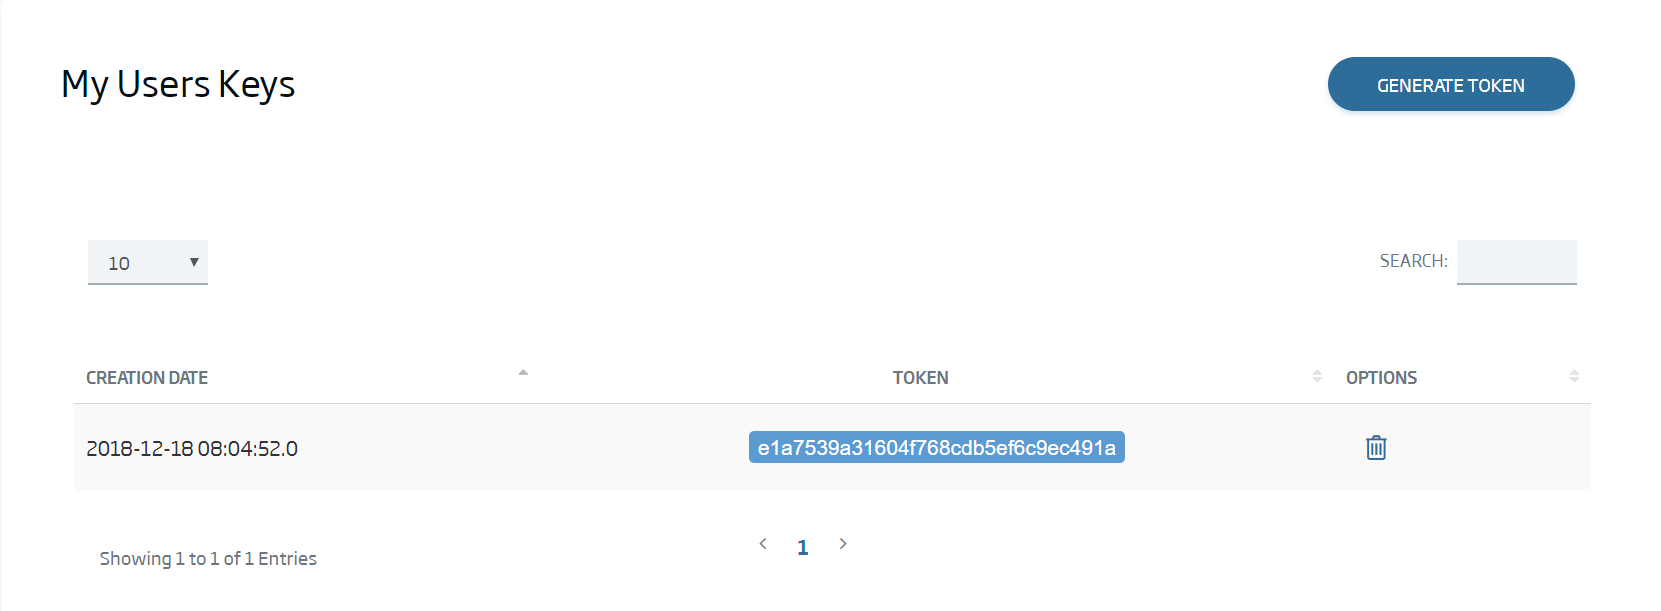
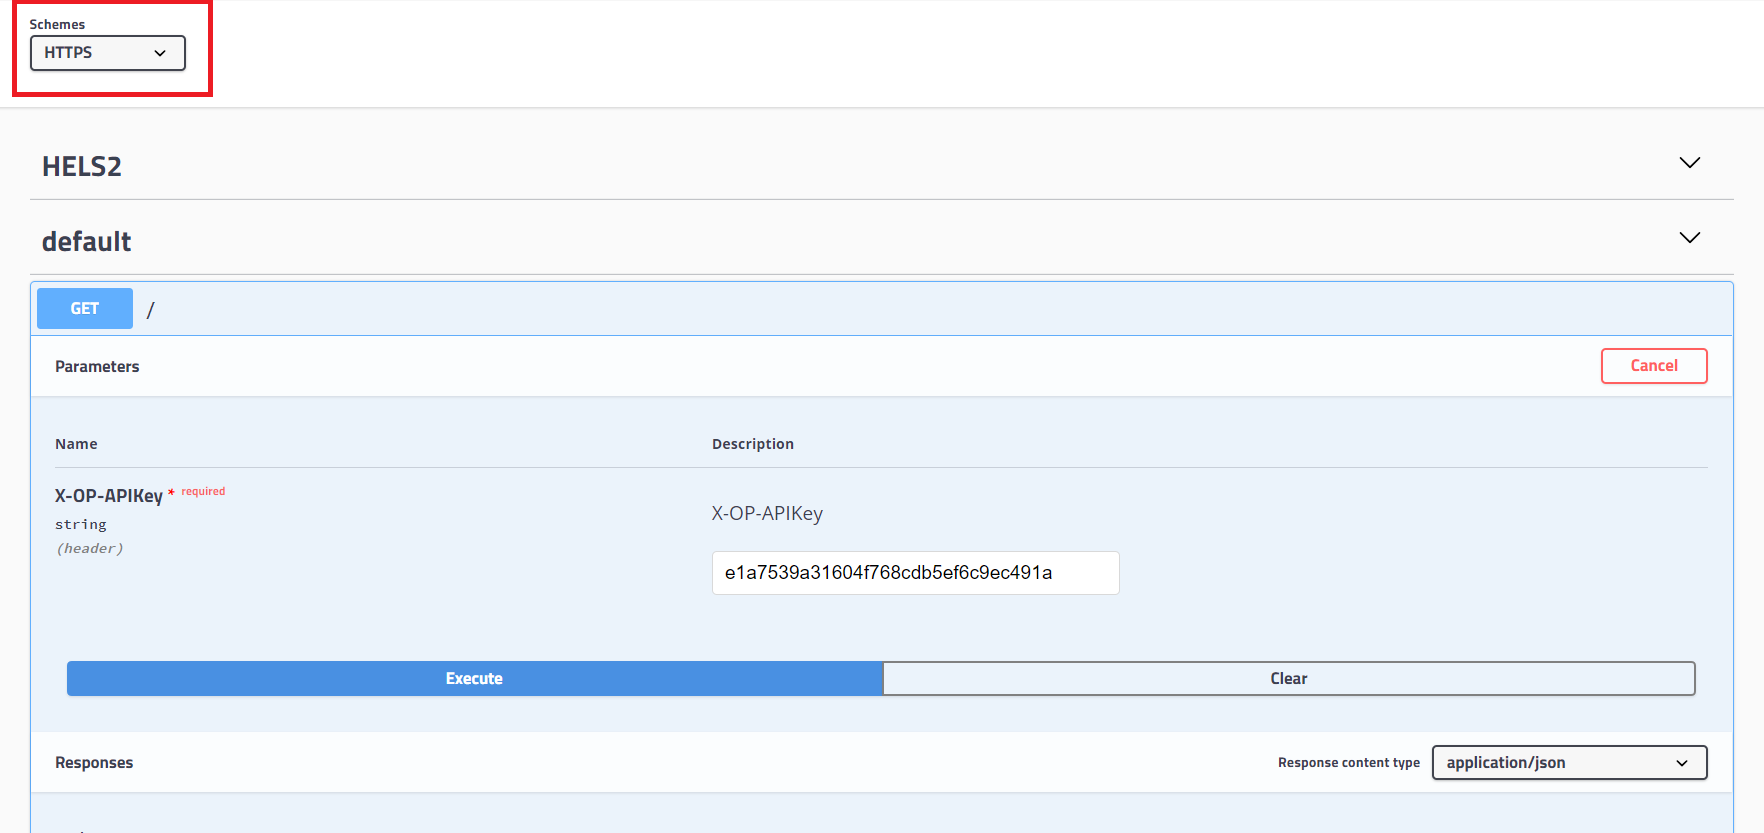
To check whether the API is accessible, you can test from the Swagger (which requires having the API Manager module on). Depending on the query type, it may require additional parameters; but, if you make a general GET query, the only needed parameter will be the user's token. This token can be seen in the "My APIs" tab, in the button "User Tokens".
If everything went OK when making the query (Remember you must change to HTTPS in the field Schemes), the response in the Swagger will be positive and we can go on.
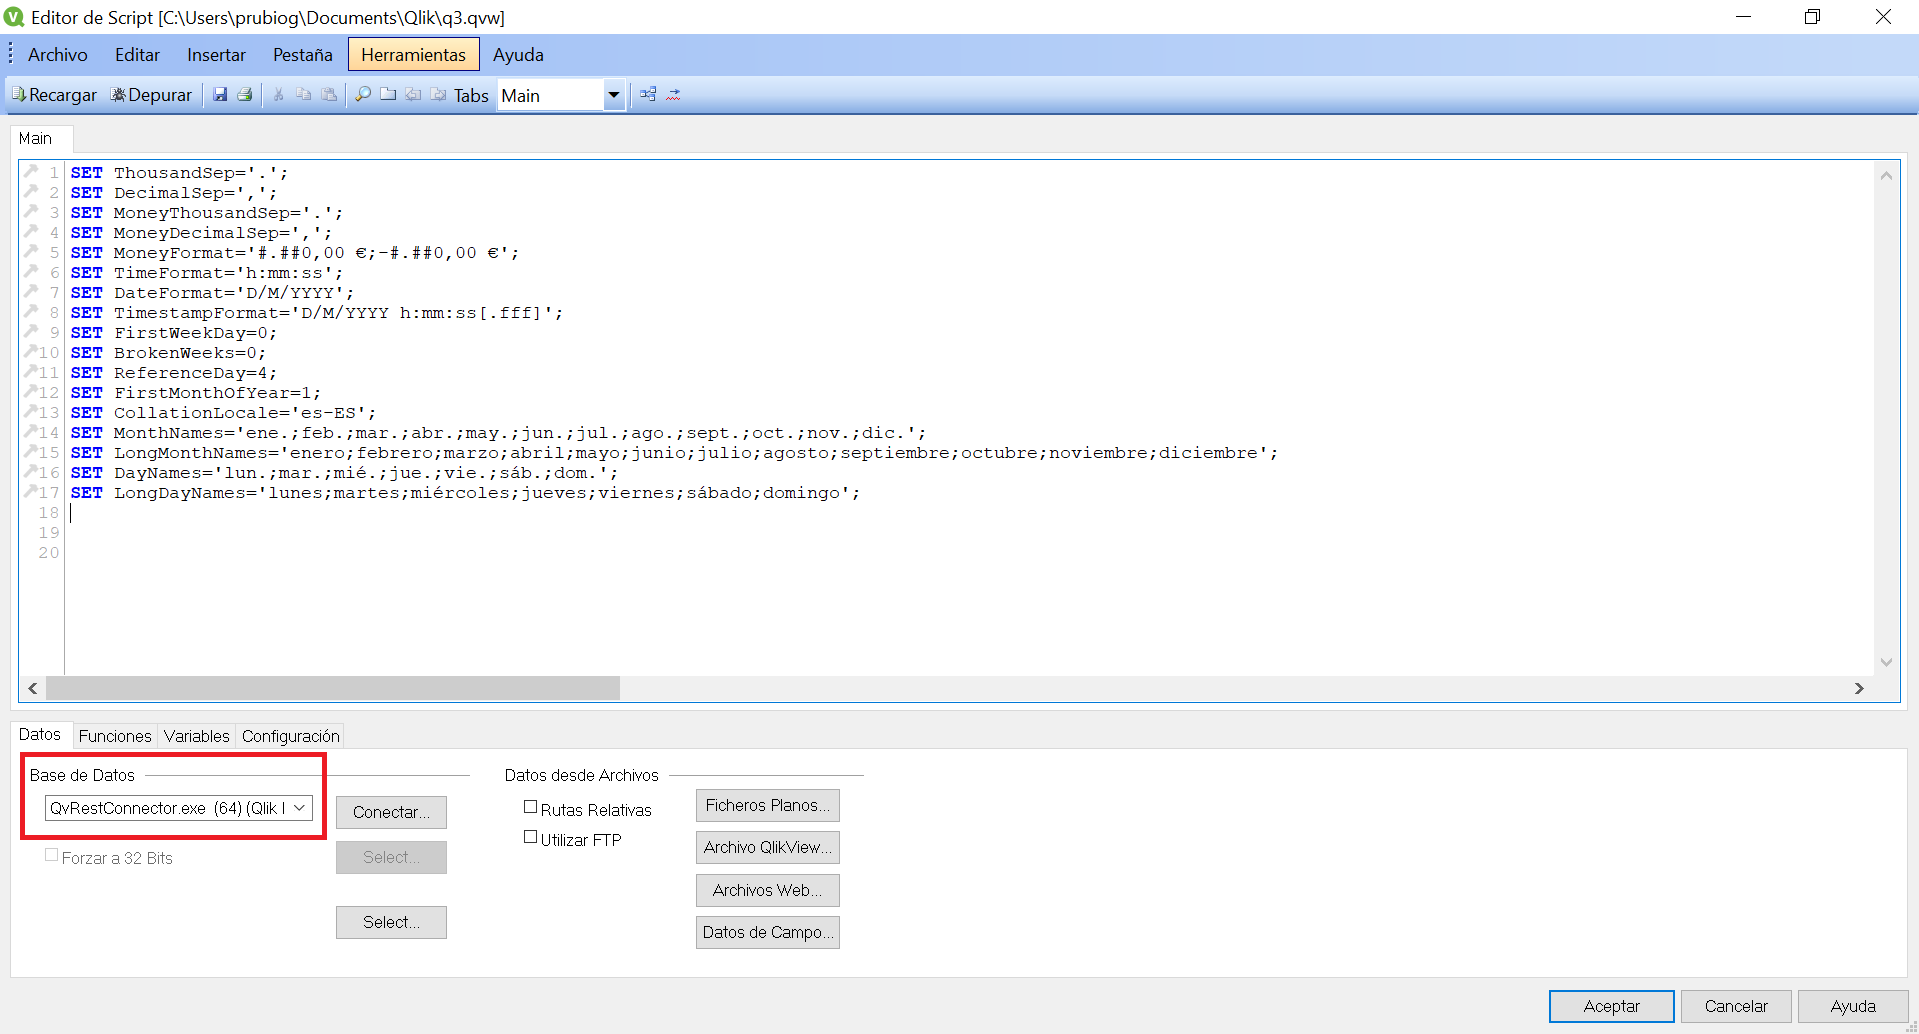
In QlikView, a new screen opens and you can access File > Script Editor. In the newest window, you must change the drop-down option from Database to QvRestConnector.exe.
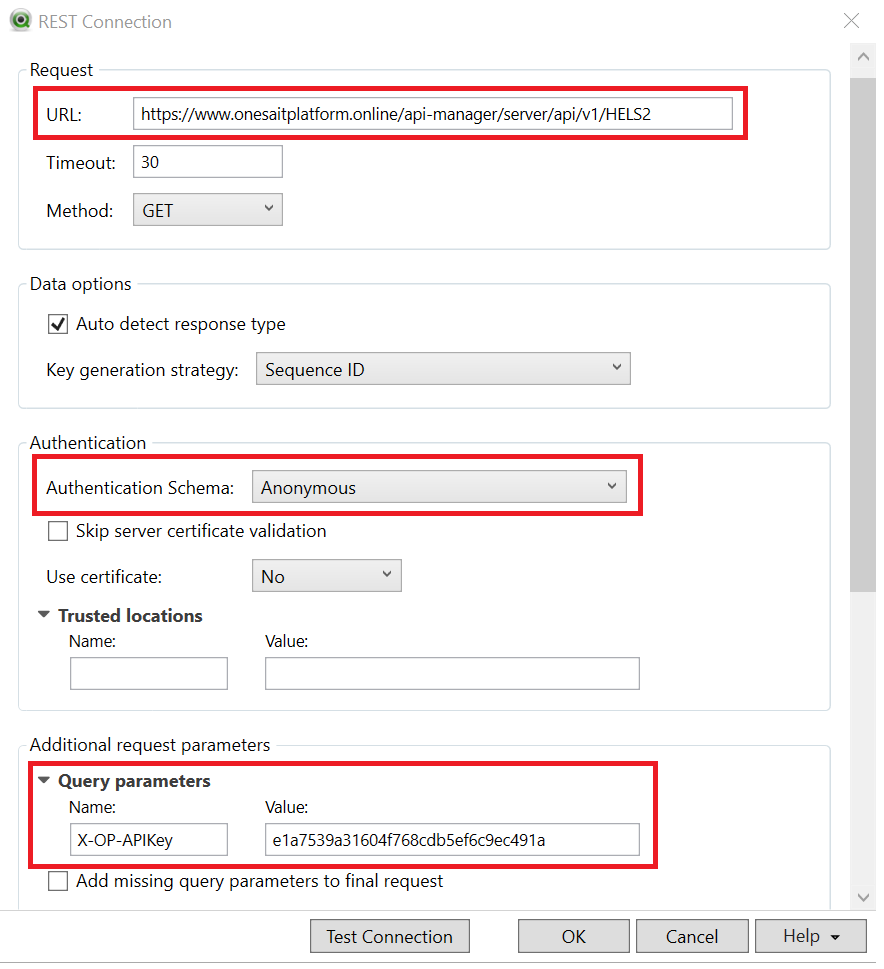
Next, click on the button "Connect", where the REST API connection's details are specified: Destination URL (API's Endpoint Base), header to specify token and authentication type (Anonymous in this case because the token is in the headers). These parameters must be inserted in the fields that are marked in the next image.
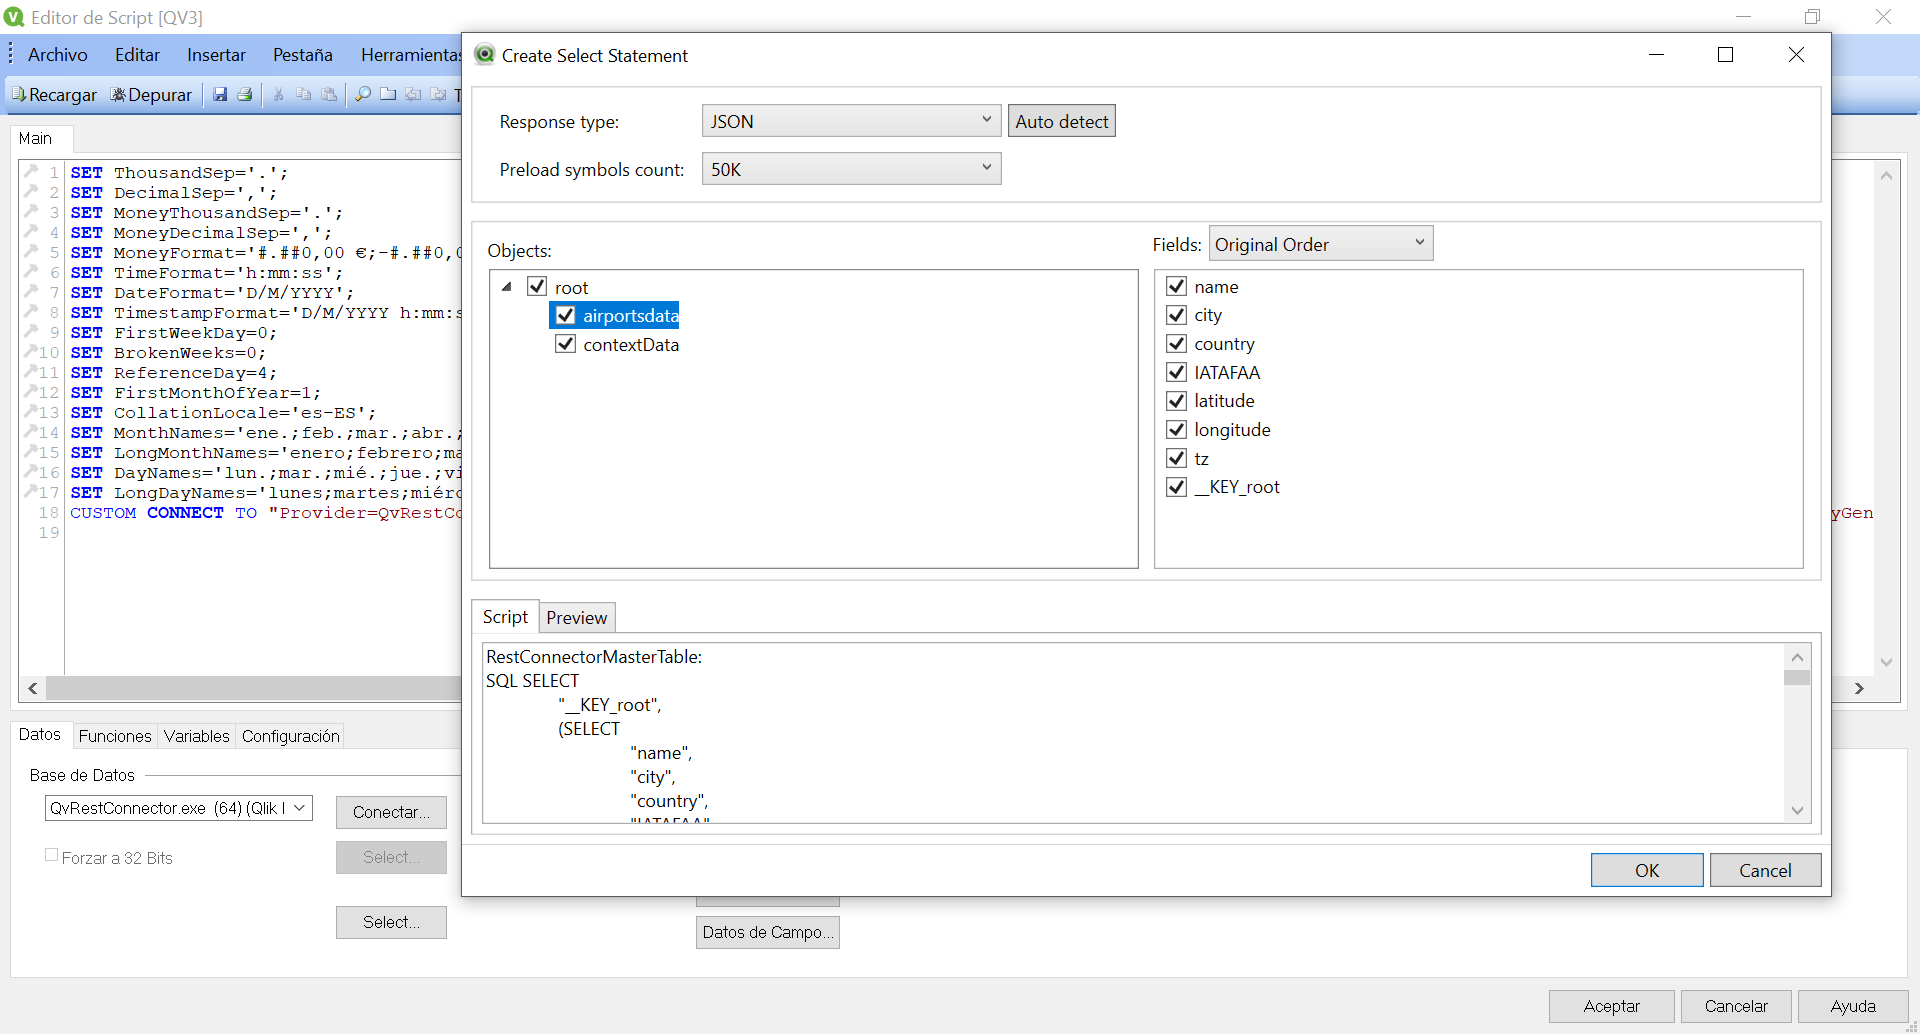
After clicking "OK", a new line will be added to the script. The next step is clicking the now-enabled button "Selected". This will enable a new window specifying the data model that are accessed by the previously-given URL. You must specify the fields you want to import, or click the root checkbox to select all of them. When you accept, more instructions will be loaded on the script. After this, click on the Script Editor's "OK" button.
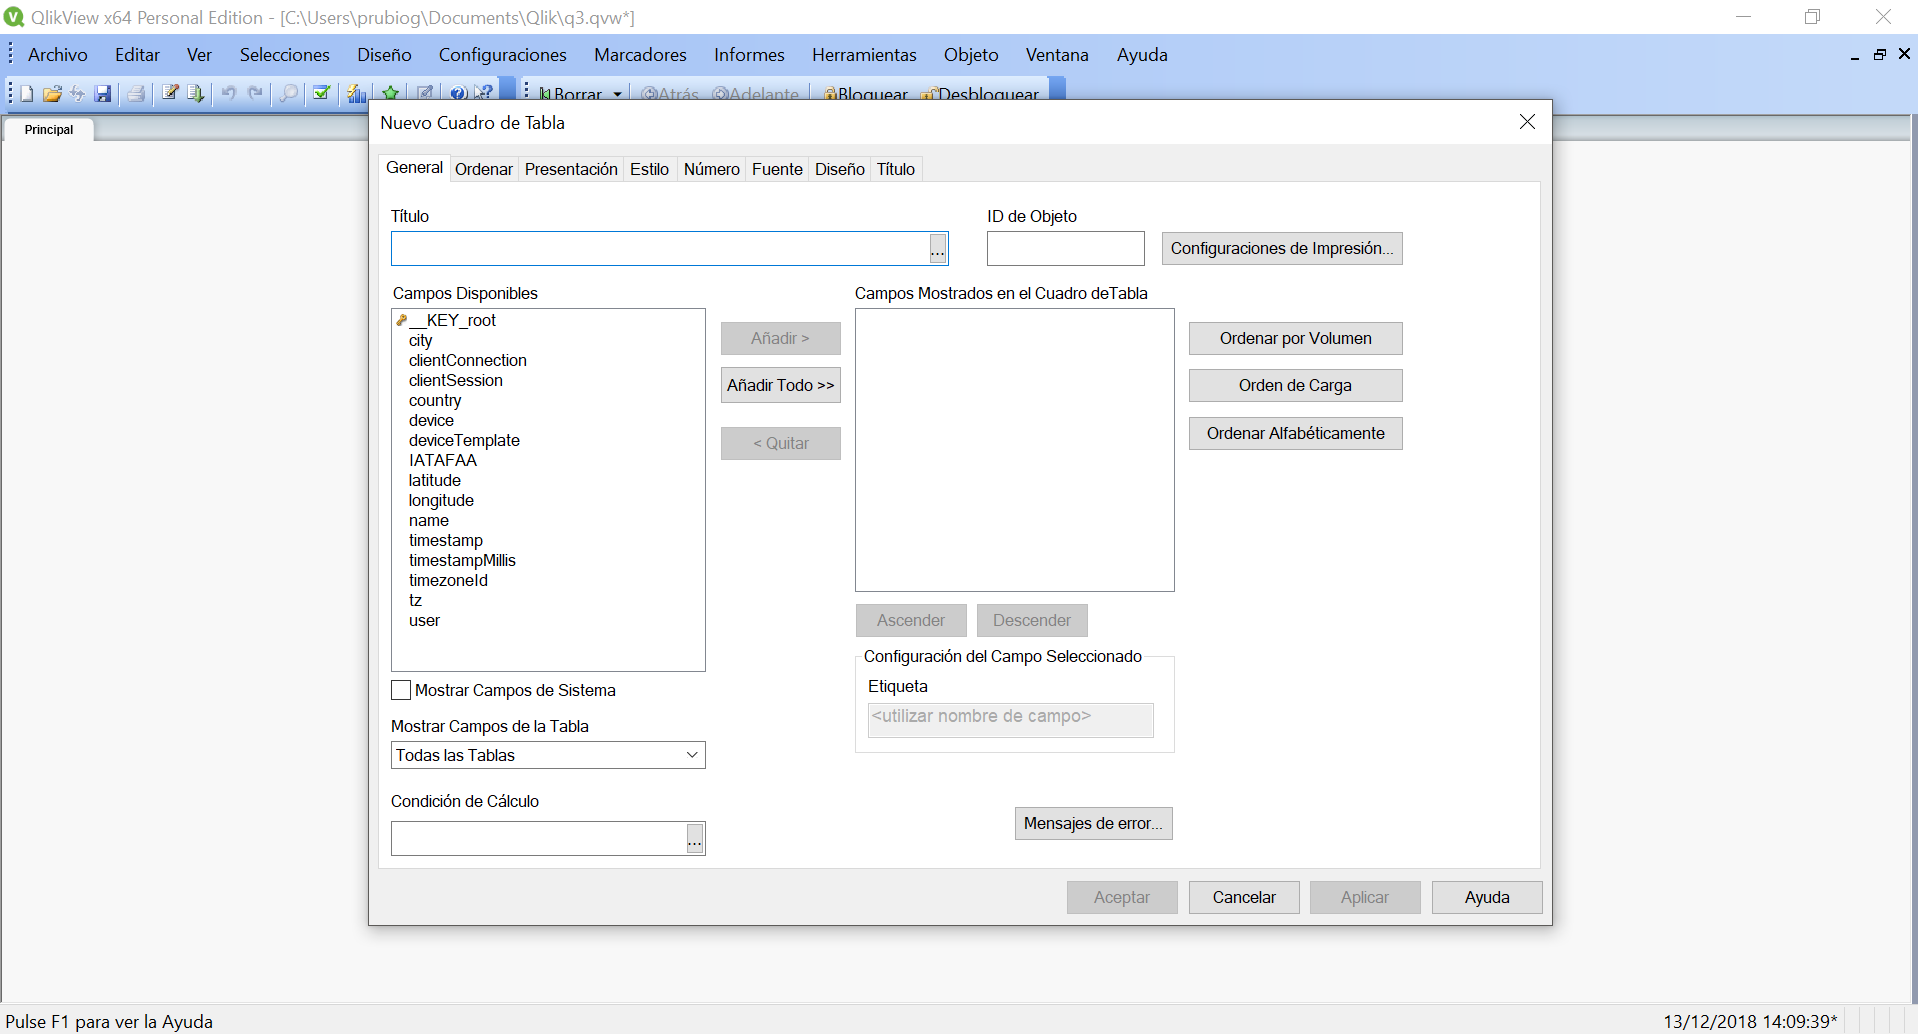
Lastly, to load the data, you must run the script in File > Run Script. To check that the data are loaded, you can create a table to show the data by right-clicking, then choosing "New Sheet Object" > "Table Box". In this new window, add all the columns and select "Accept". This will create a table with all the imported data.
To add a graph, it's similar to the previous explanation, but choosing the option "Graph" in the drop-down "New Sheet Object". In the window, choose the graph type and its title among other options.
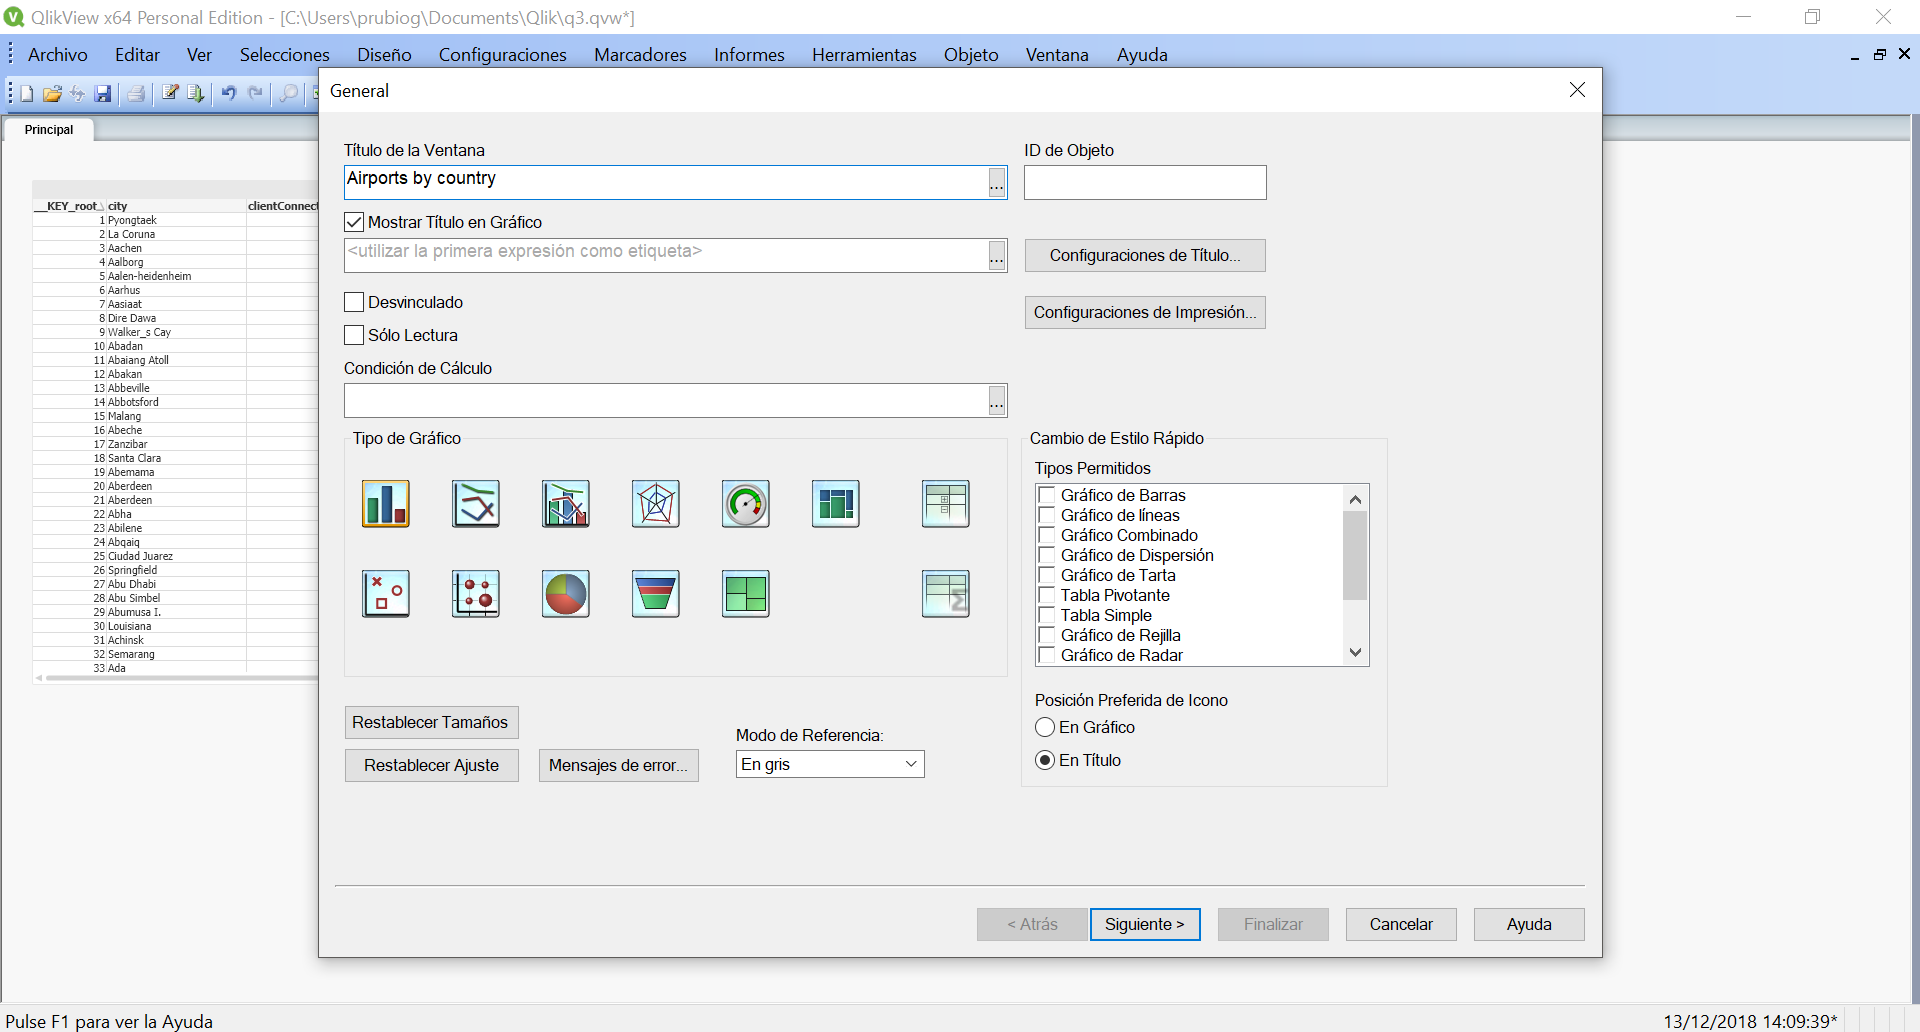
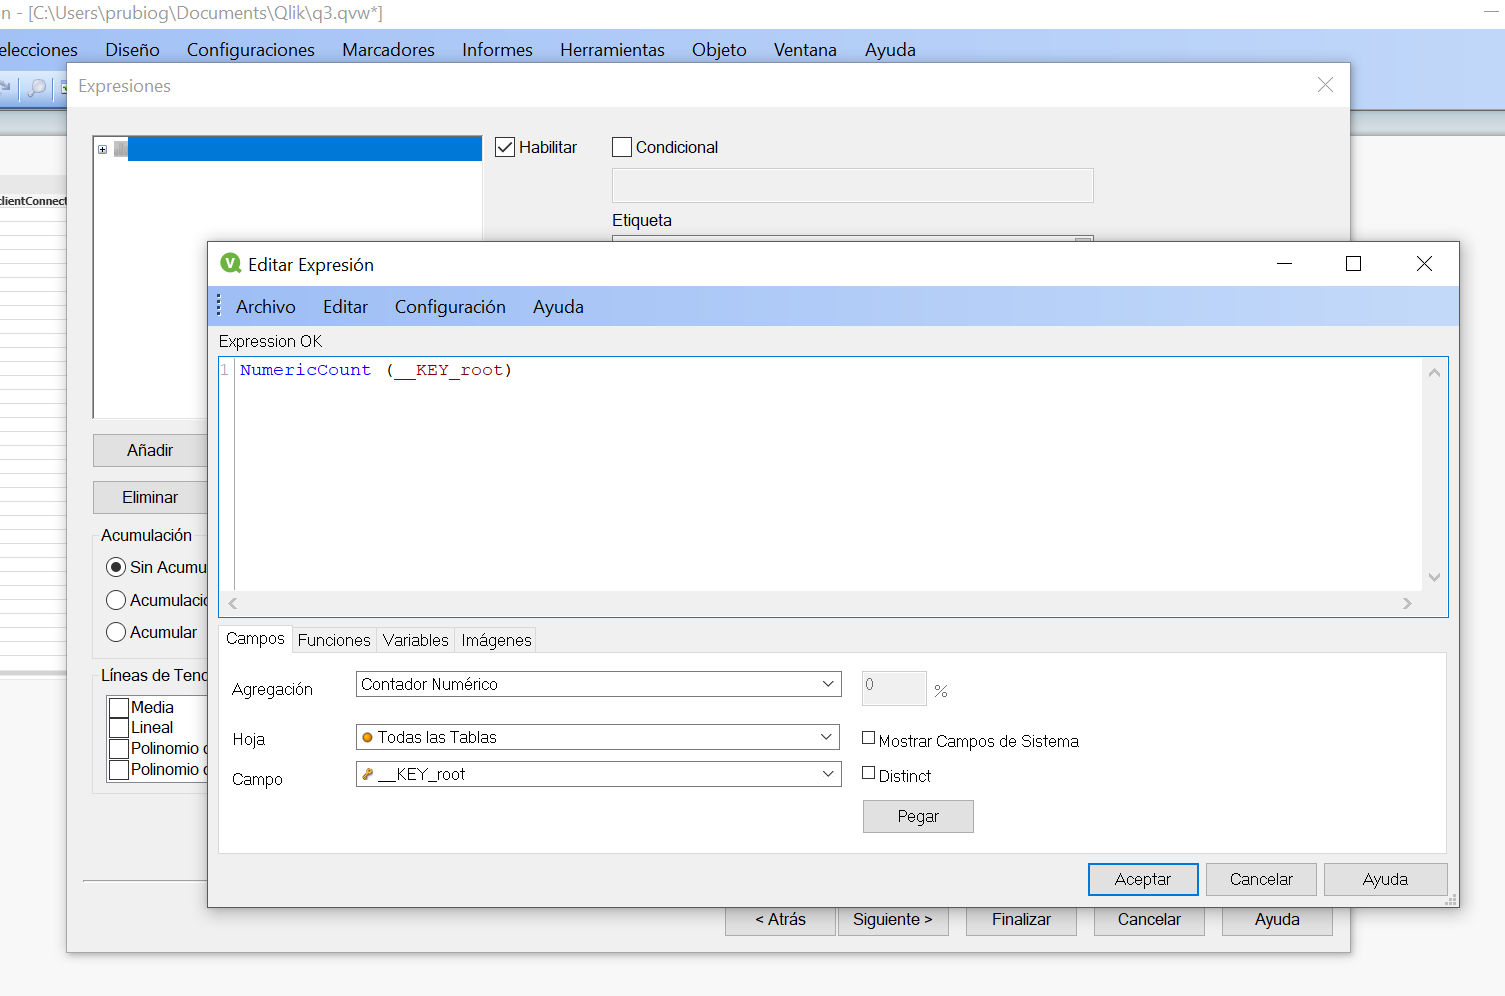
In the next screen, select a variable for the X-axis; in the following one, the variable for the Y-axis; in both cases as an Expression, allowing performing operations such as addition, mean or count. After that, you can click to end and the graph will appear on the screen.
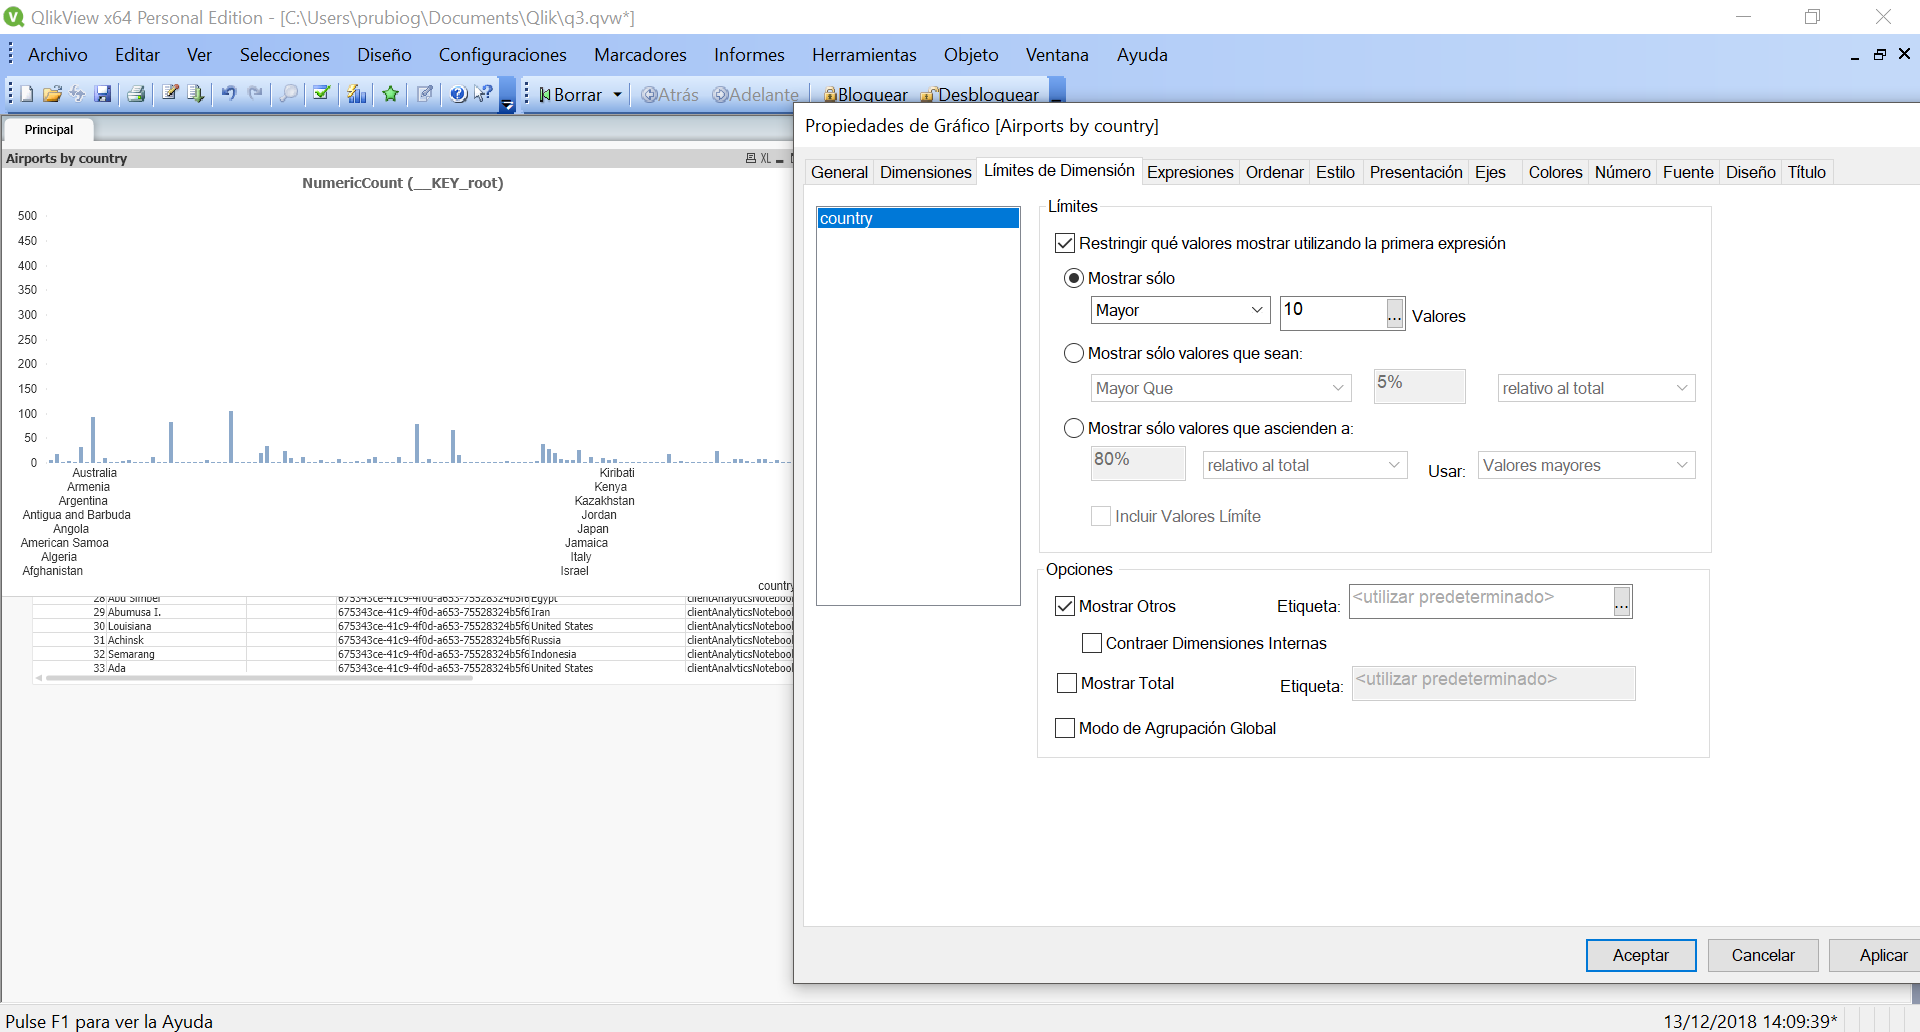
However, you may need for some values not to appear because they may make the graph hard to understand. To achieve this, you can restrict the number of values to be represented, by editing the graph in "Properties" and changing in "Dimension Limits" the number of elements, grouping the other elements in an "Others" field.
You can also represent the information in other types of graph (pie chart), as you can see in this figure: